Particle analysis is a crucial process, but it can also be a source of uncertainty. As a scientist, you may have wondered how many particles are being analyzed, especially if you’re using low-volume samples. Such concerns can raise doubts about the accuracy and representativeness of your sample. In the end, you need to know that the particle analysis you’re conducting is producing consistent and reliable data.
Fortunately, measuring sample variability and error can help answer these questions. With Aura particle analyzers, we make it easy to perform these measurements as part of your method development, ensuring you can have complete confidence in your results.
Analyzing Variability
To determine the optimal sample volume in an Aura® assay, you first need to understand variability. There are two types: sample variability and instrument variability. Unlike traditional methods, Aura allows you to directly measure both in a single assay, providing a complete understanding of the method that no other particle analyzer can offer.
Let’s look at an example of how particle analysis works in a simple experiment. Imagine you have two samples of different formulations. After setting up your assay and mixing each sample, you add 50 µL of each sample to the well and read the results. Sample A has an average of 1,000 particles/mL with a CV of 5%, while Sample B has an average of 1,100 particles/mL with a CV of 25%.
What does this tell us about each sample? By analyzing the level of variability within each sample, it’s evident that Sample B is clearly more variable than Sample A. This suggests that the population of particles in Sample B is not as homogeneous as the particles in Sample A. Sample B may have a greater distribution of sizes, which the details of the particle counts will tell you.
Aura not only gives you the ability to run replicates of each sample, but it also provides insight into instrument variability. By simply cloning the background from the previous experiment and re-reading the plate, researchers can perform this test as many times as they need. The results demonstrate that Aura has minimal to no instrument variability. Each well will always report the same number of particles, regardless of how many times the sample is measured. Therefore, any variability when running the Aura is a result of sample variability, not instrument variability.
Measuring Sampling Error
When analyzing subvisible particles, it’s important to distinguish between the population, which refers to all particles within an entire container, and the sample, which is defined as any volume taken out of that container. To determine how well a sample matches the population, a measurement of the sampling error is required.
Sampling error is a measure of the sample variability and can be expressed as standard error (the variability of samples drawn from the same population), standard deviation (the variability of a set of data), or the coefficient of variation (the ratio of the standard deviation to the average, or the extent of the variability in relation to the average of the population).
If the sampling error is high, the sample will not reflect the population. This can occur due to a variety of factors, including bias in the sample selection or random variation of the sample. It’s important to note that subvisible particle samples are heterogeneous, so naturally, there will always be a degree of variation. To minimize the potential for sample bias, we recommend using a random sampling method when collecting samples from the container being tested.
To ensure that the sample you apply to the membrane is representative of the population, we suggest gently inverting the closed container 20 times and pipetting the desired volume from the middle of the container. Repeat this process for each replicate with a minimum of five container inversions between sampling. Following these guidelines will allow you to obtain a representative sample of your population.
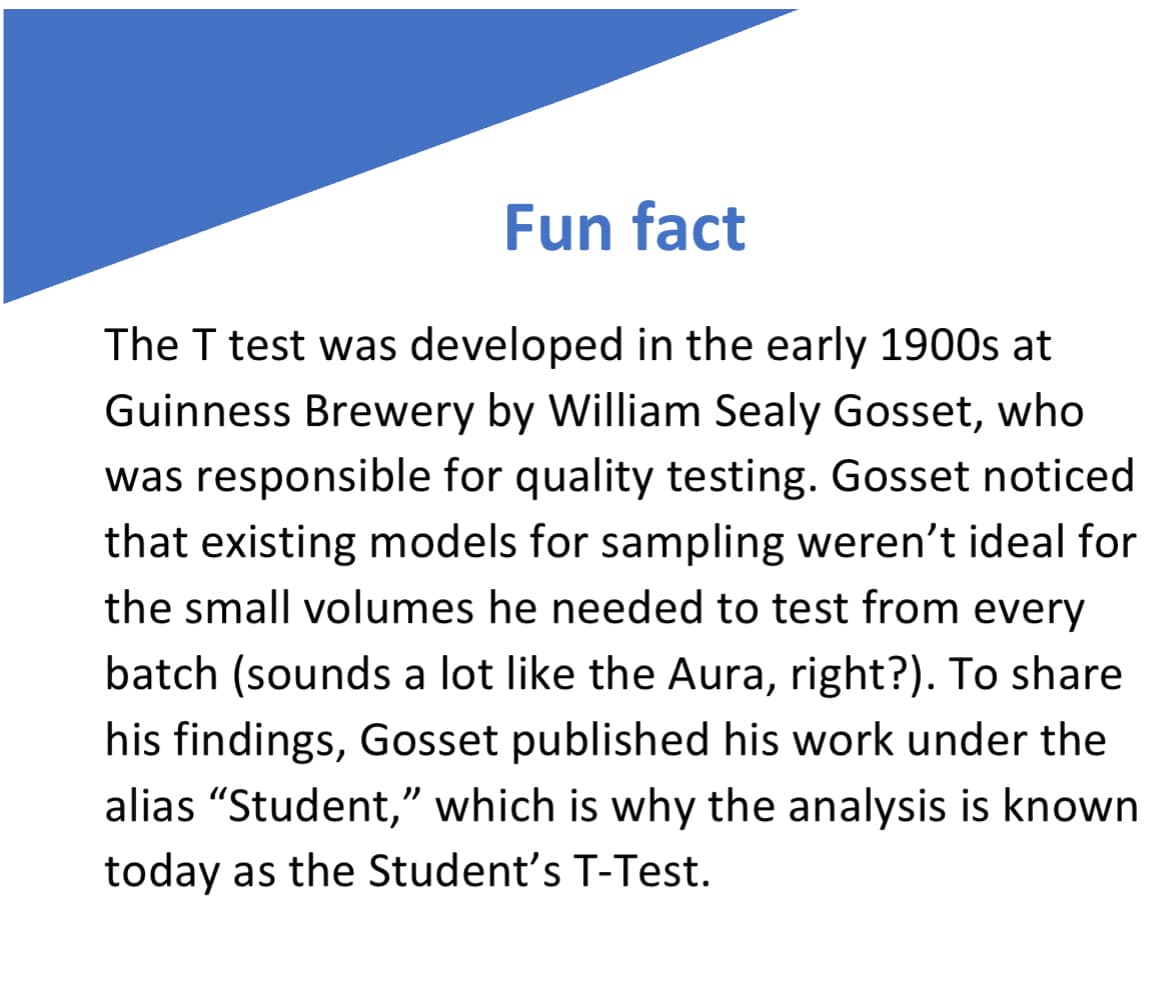
To test whether your sample is representative of your population, you can perform a T-Test.
Suppose you have a sample, and you want to run replicates of three at 40 µL/well. To determine if the data is reliable and representative of the population, you will need to compare it to something. In this case, another set of three replicates of the same sample at 40 µL/well (Table 1).
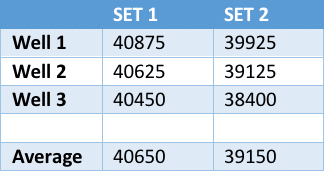
The goal is to evaluate whether the average of the first three wells matches the average of the second three wells within the expected variability, which in this case is our pipette accuracy of 5%. To do this, we run a T-Test and obtain a P-value of 0.388, indicating that Set 1 and Set 2 are indeed equal. From this result, we can infer that using 40 µL/well correctly samples the population.
On the other hand, if the P value is less than 0.05, you would reject the hypothesis that the two samples were the same. This would suggest inconsistent sampling from the population, which could be due to poorly mixed samples between wells, pipette errors, or insufficient volume drawn from the population to get a representative sample.
After ruling out the first two options, adjusting the volume is easy with Aura. Under most formulation conditions, one well can hold up to 75 µL. The volume can also be easily increased by adding an extra well or two. One of the biggest advantages of Aura is that it’s not limited by volume, making it ideal for both low-volume or larger-volume operations depending on the needs of the sample.
Do Perform Particle Analysis with Statistical Rigor
Obtaining accurate and reliable data is essential when performing particle identification and characterization. To achieve this, particularly when you are using small volumes of your sample, it’s crucial to use advanced techniques that allow for the direct measurement of both sample variability and instrument variability.
That’s exactly what Aura offers. With Aura, researchers can conduct particle analysis with ease, gaining a comprehensive understanding of the particles in their sample. By eliminating instrument variability, Aura provides researchers with precise and trustworthy data, enabling them to draw meaningful conclusions from their experiments.


